dispersion

Contents
For a word list or for clusters computed from a WordList index, dispersion is calculated using the same formula as for a dispersion plot in Concord. It splits the corpus up into a number of divisions (default = 8) and for every word, computes how the word spreads out in the whole set of texts. It needs to allocate some memory space to the divisions as it works. You can set the number of divisions the procedure uses in the main Controller.
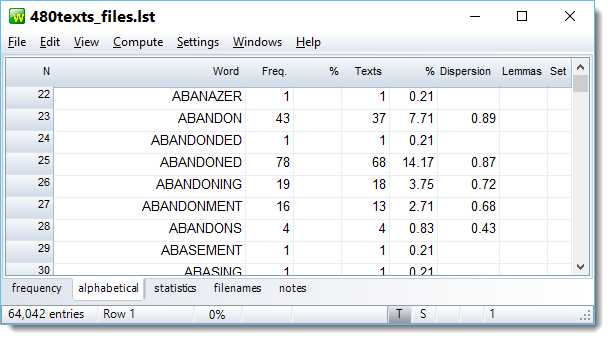
The word with highest dispersion in this shot (ABANDON) is the one which is most uniformly spread through the corpus. It was present in only 7.71% of the texts. ABANDONED came more often and in more texts but was similar in dispersion. A word which is present in nearly all texts such as a grammar word may reach 0.99.
Understanding what the dispersion really shows
The listing above was computed using the whole corpus of 480 texts. If we compare with a dispersion plot in Concord, note
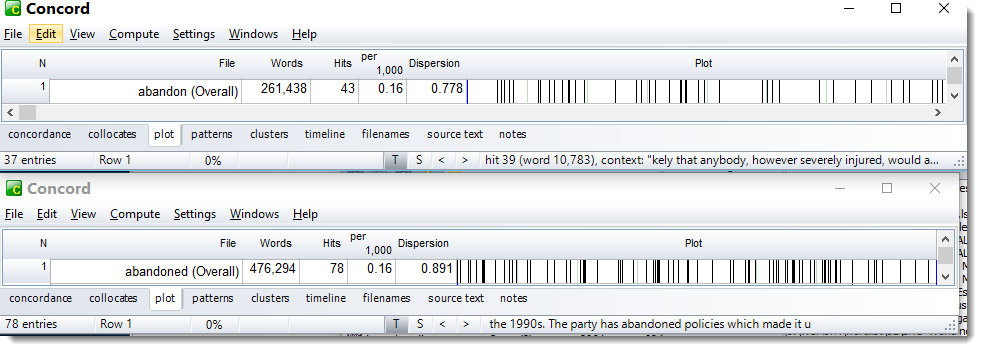
that the dispersion scores are computed differently, using only the text files in which these individual items appeared (37 ABANDON and 68 for ABANDONED -- contrast also the number of Words in the two plots). As a result the dispersion values are different from those in a word list over many more texts.
See also: Concord plot dispersion